Zenvest
An investment ecosystem with a shared workspace for assets, analytics, and commerce.
Zenvest brings an account dashboard, project marketplace, portfolio, analytics, and E-shop into one web application. A consistent sidebar, modular cards, and structured tables connect these areas through a shared interface.
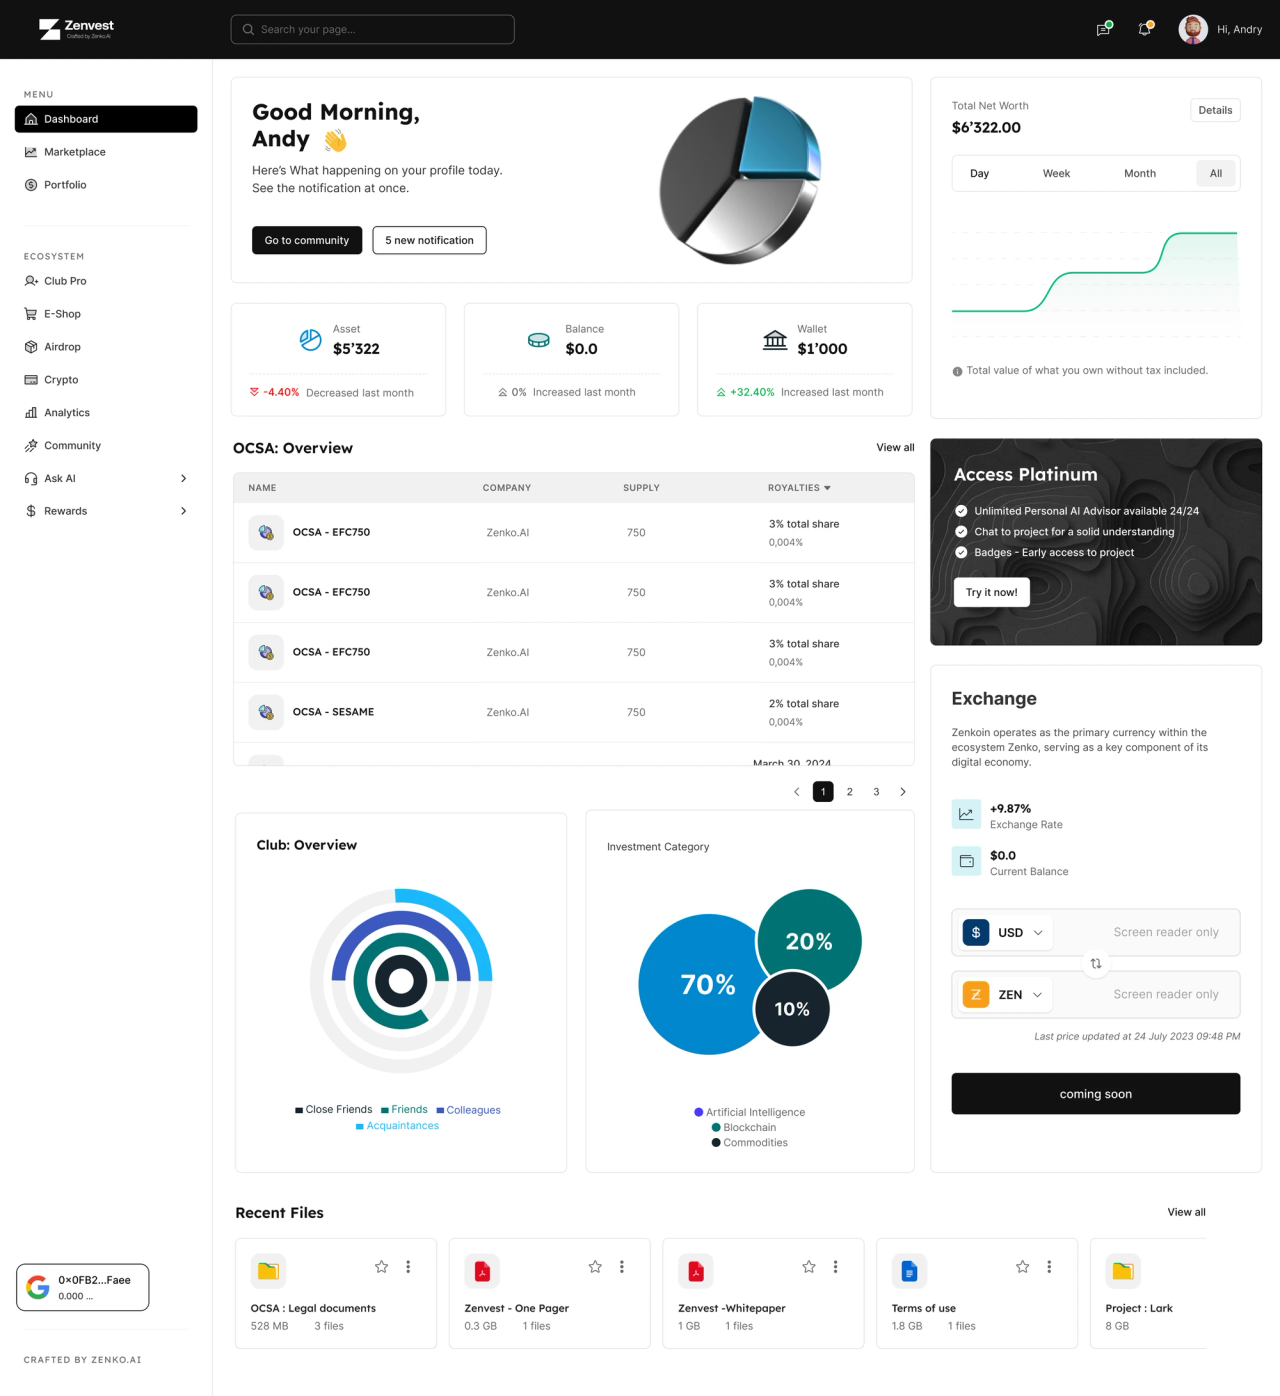
Dashboard — account summary, net worth, asset overview, and recent files
The account at a glance
The dashboard brings assets, balance, wallet, and net worth into one overview. Summary cards sit alongside an asset table, investment categories, and recent files, while the sidebar keeps the wider ecosystem accessible.
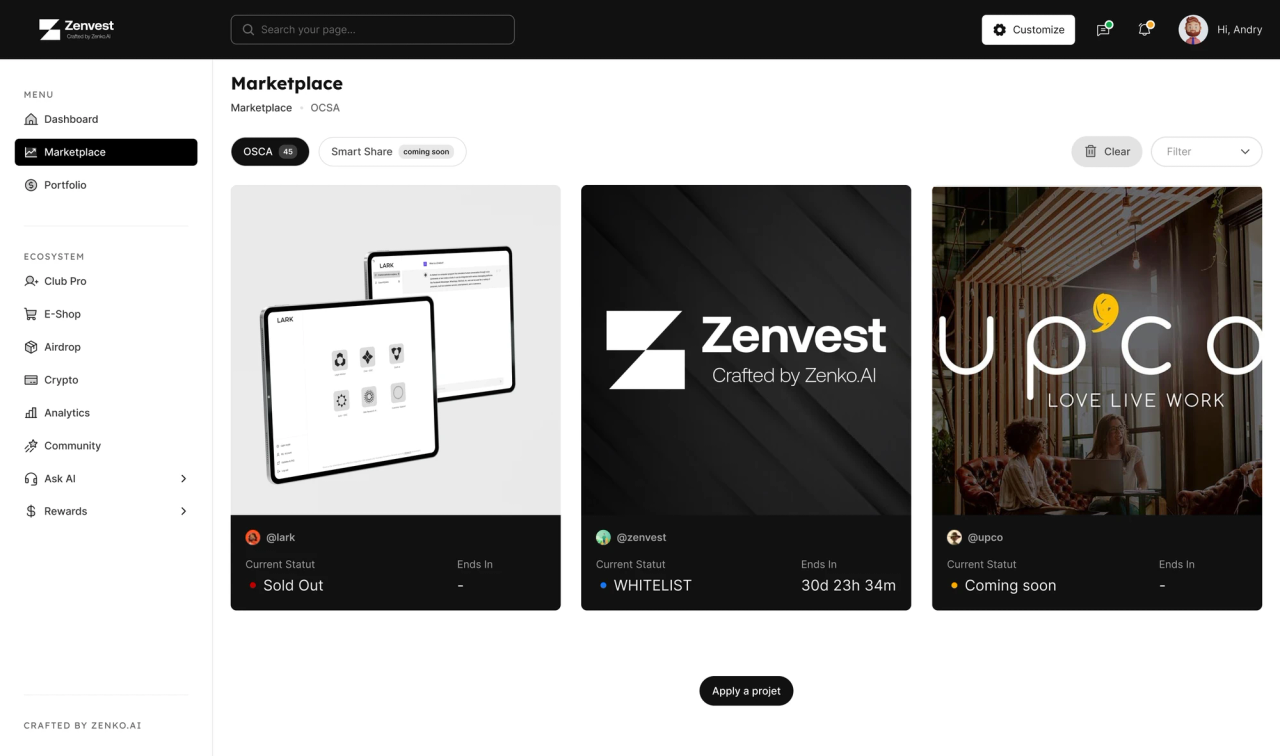
Marketplace — project cards, availability states, and filters
Browse the marketplace
Project cards pair a visual identity with an availability state, including Sold Out, Whitelist, and Coming Soon. Tabs and filters organise the catalogue, and a separate action lets users apply a project.
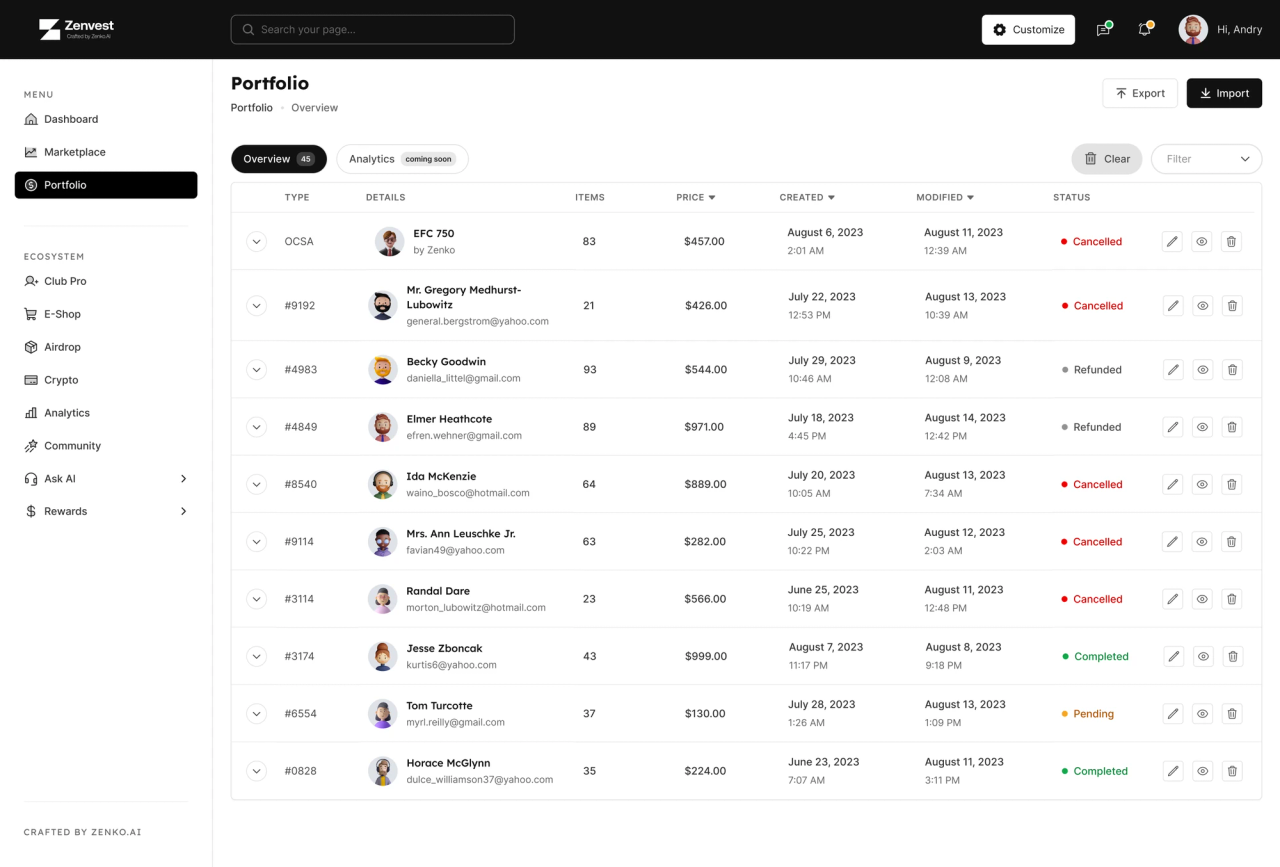
Portfolio — asset records, dates, prices, statuses, and import/export actions
Review the portfolio
A structured table keeps item details, prices, dates, and status labels aligned for comparison. Filters, import and export actions, and controls on each row support working with the portfolio from a single view.
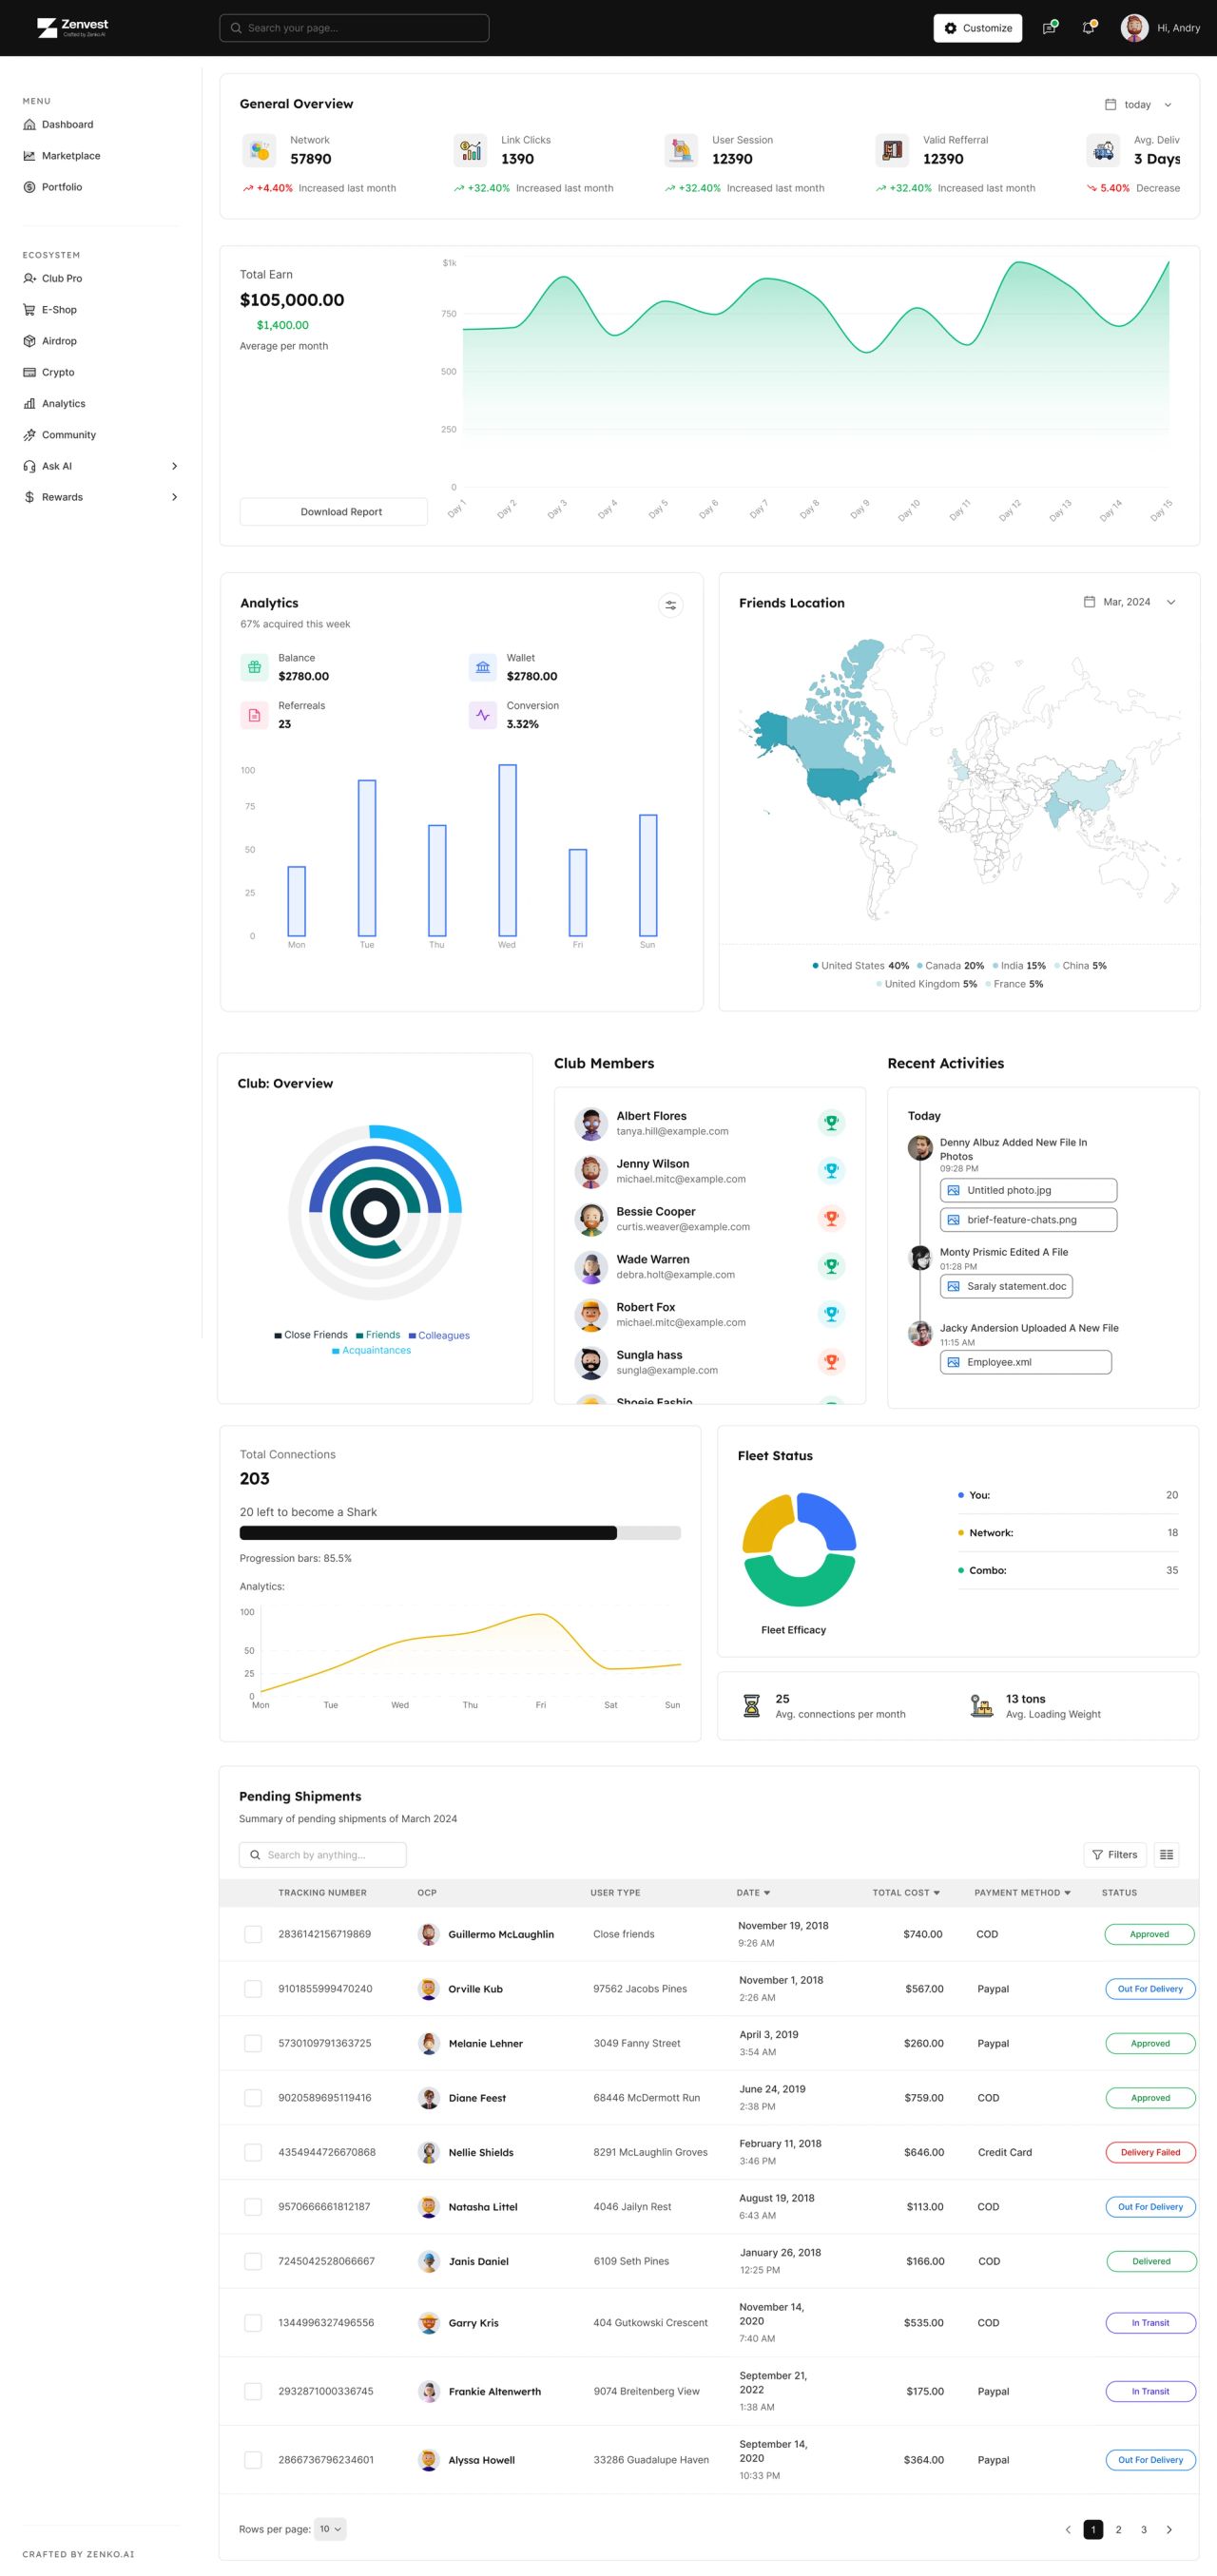
Analytics — summary metrics, earnings, network activity, and pending shipments
Move from summaries to detail
The analytics page combines summary metrics with earnings charts, location data, club activity, and a pending-shipment table. Consistent cards and table layouts organise several types of information within the same navigation system.
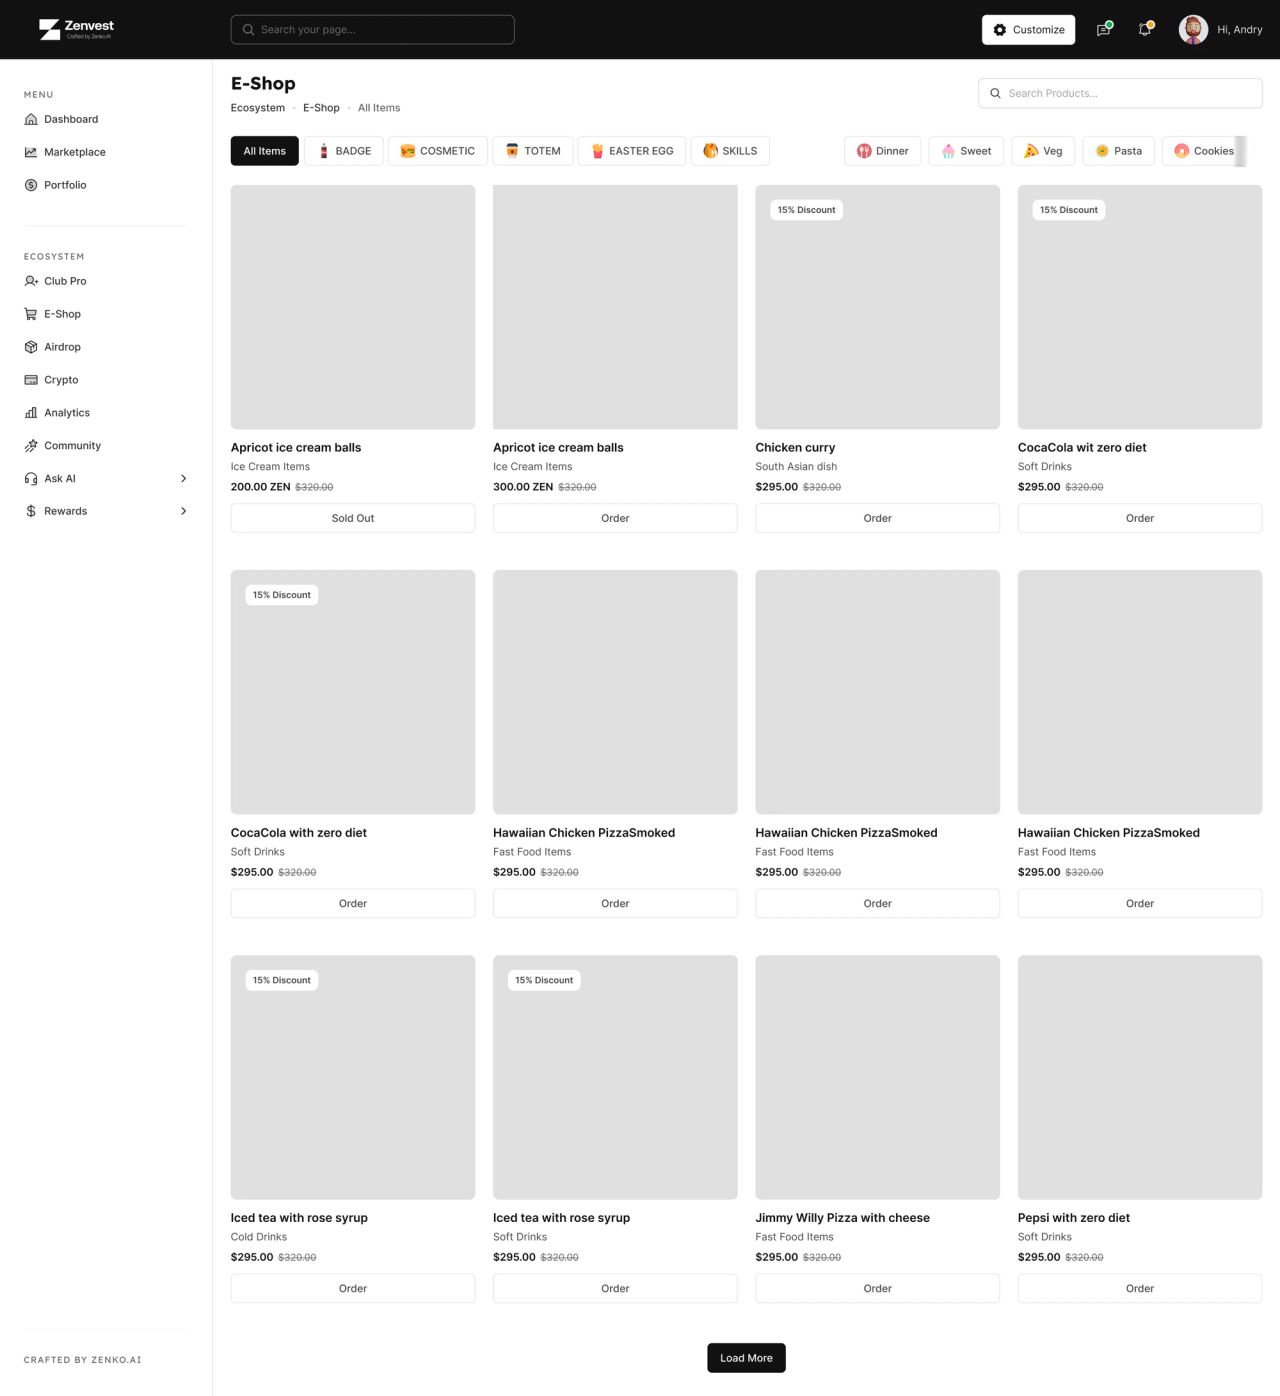
E-shop — categories, product cards, prices, availability, and ordering
Extend the ecosystem into a shop
The E-shop reuses the application navigation for browsing products. Search, category chips, price labels, discount badges, and ordering states give the catalogue a clear structure, with Load More continuing the list.
Our approach
Keep navigation consistent
A shared sidebar and header connect the dashboard, marketplace, portfolio, analytics, and shop without changing the navigation model.
Give data a clear hierarchy
Summary cards introduce the main figures, while charts and structured tables provide the detail needed to explore each area.
Make states easy to scan
Availability labels, status colours, filters, and row actions distinguish what users can review or act on within each view.